Rootstock
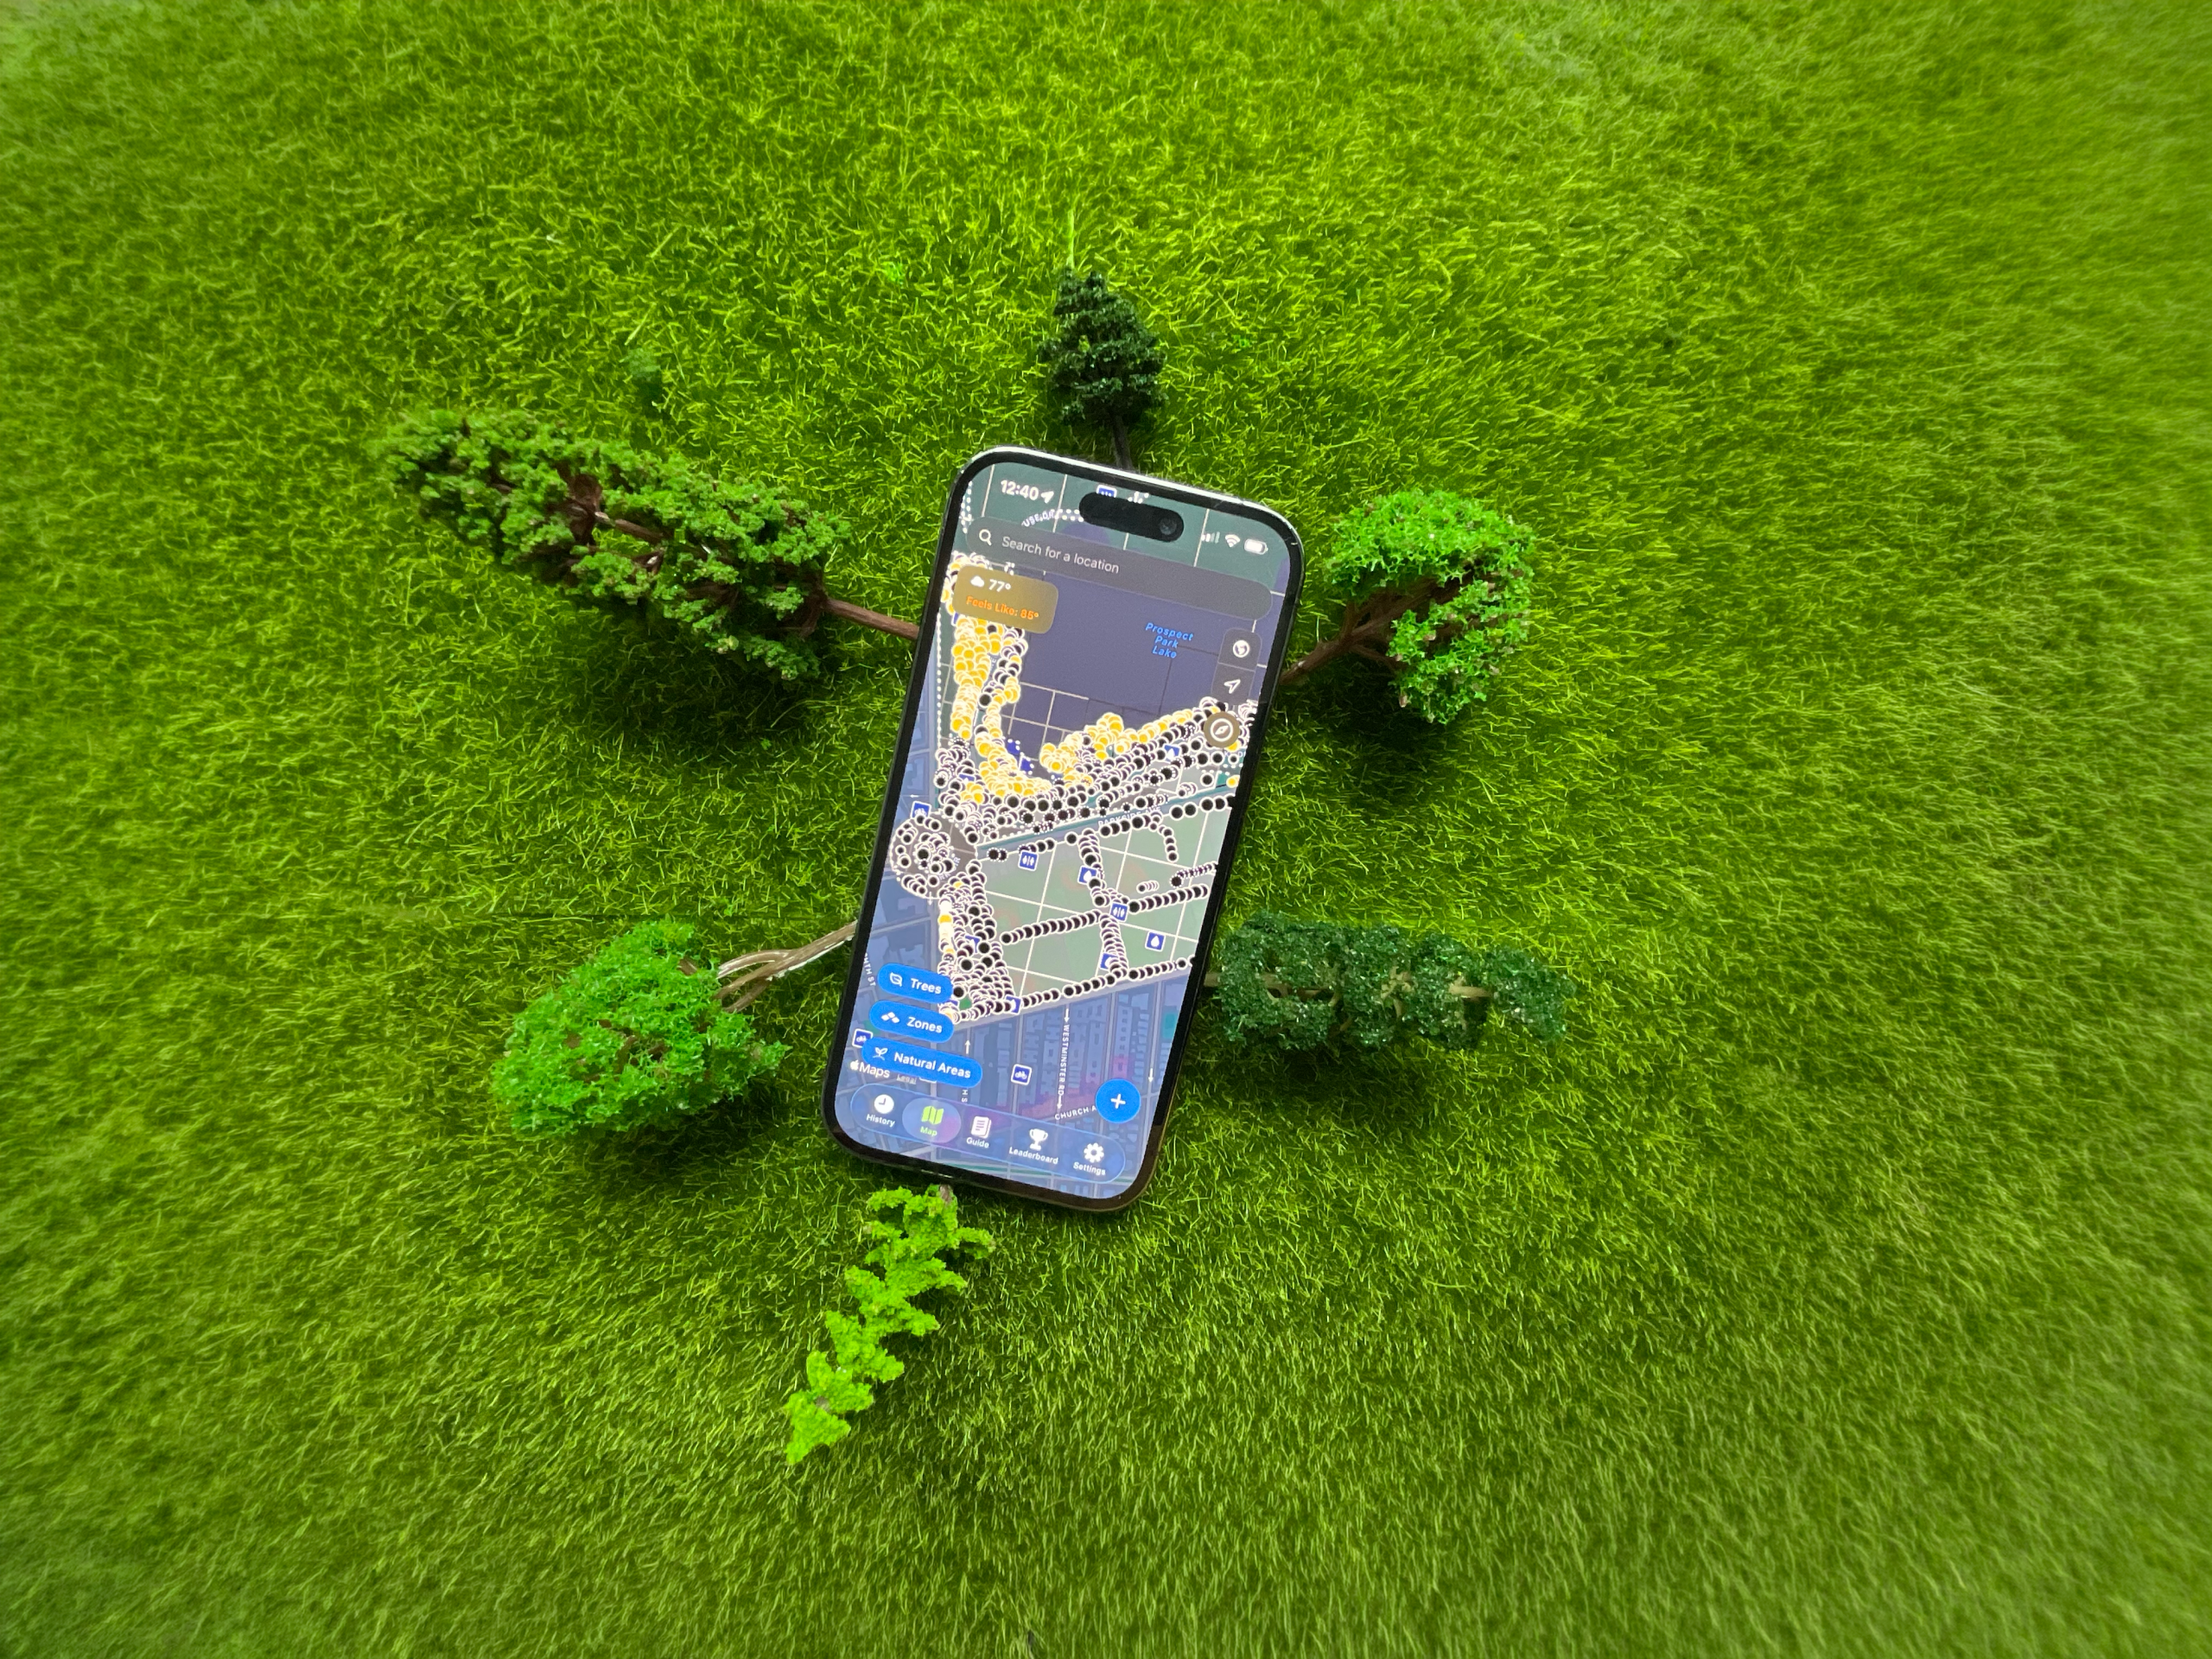
I’ve surveyed over 12,000 trees in parks across the five boroughs of NYC, mostly over the past month. Skipping the “why?” for a moment, I’ll jump straight to the how: by building a completely-unofficial-yet-surprisingly-fully-featured citizen science app! It’s called Rootstock, and it features a comprehensive map of every tree in every park in NYC, along with a whole bunch of tools that make it easier to perform data collection in the field, such as LiDAR-powered trunk diameter measuring; ML-powered species classification; iNaturalist reference photos; park amenities like drinking fountains, restrooms and bike racks; weather and AQI alerts and so much more. It also currently has exactly one user: me.
The census
I started volunteering with Trees Count, the NYC Parks Department’s decennial tree census, last fall. I showed up one weekend morning at the incomparable Snug Harbor Cultural Center on Staten Island, where I was given a tote containing a fabric tape measure and a folded street tree reference guide. From there the group of ~20 of us were given access to the TC25 community in ArcGIS and were told to download their Field Maps app, after which we went through a short but thorough training lesson during which we learned how to measure a tree’s circumference, identify key health metrics, ID its species, and then input all that data into the app. After being paired up and tasked with surveying some trees at a predetermined area of the park, we were set loose. From then on, we could pop open the Field Maps app whenever we wanted to and survey some trees!
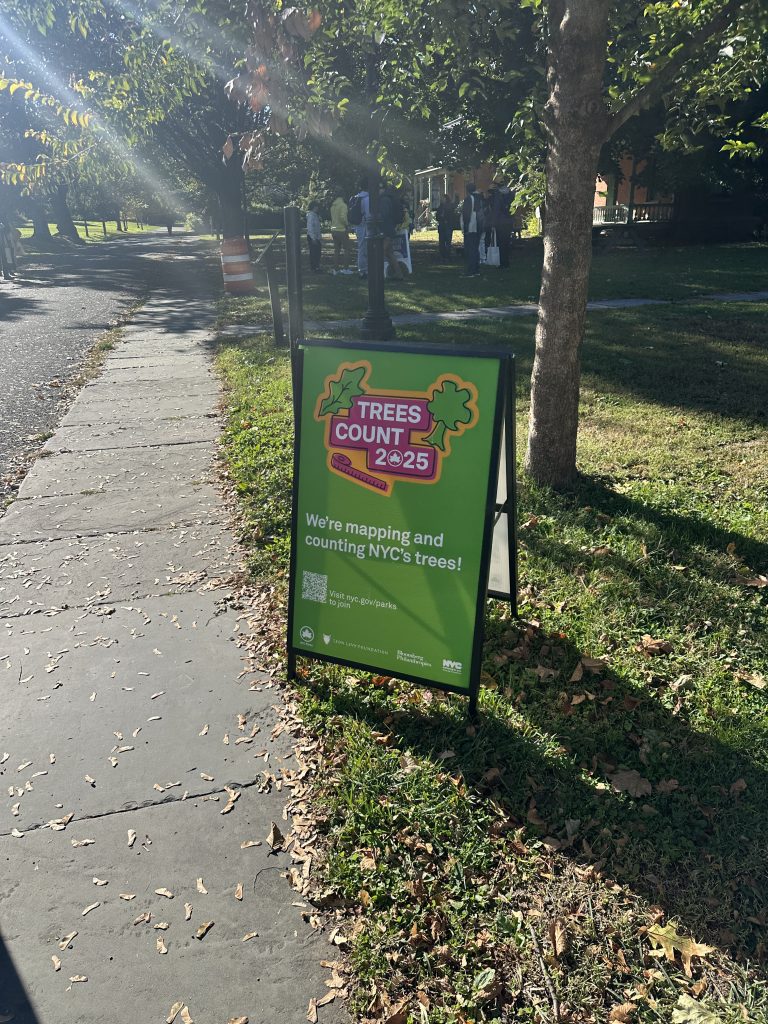
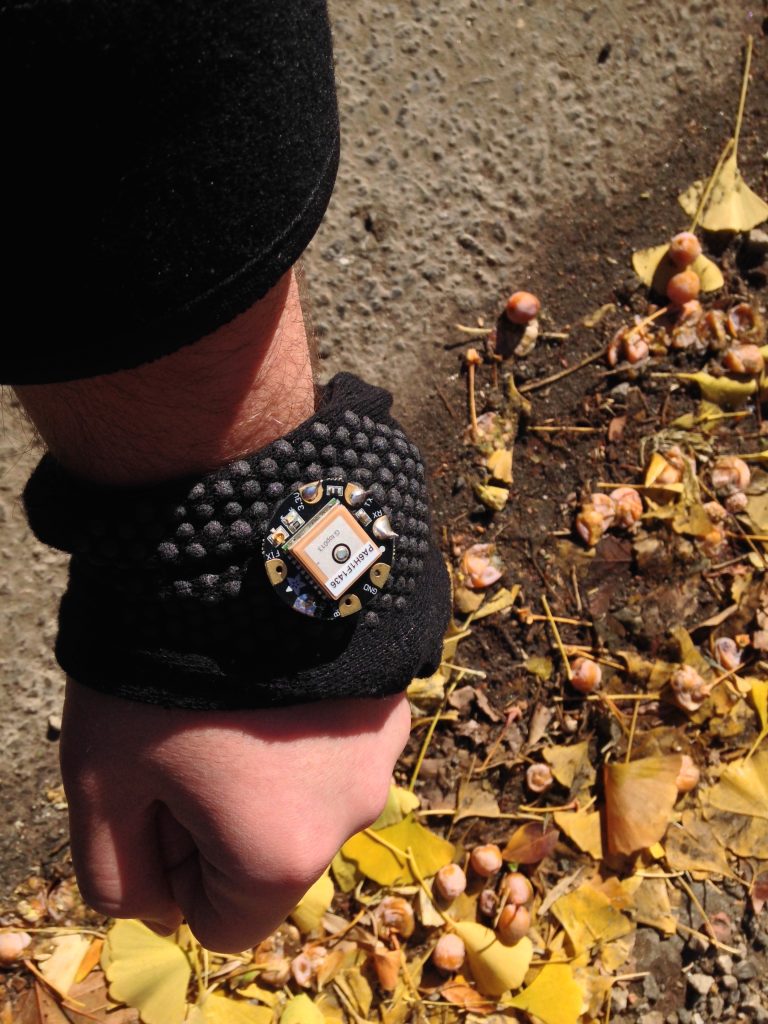
I love gathering data, and I love data entry. I always have. There’s something so soothing and meditative about it. And I adore the Trees Count program. I participated as a volunteer during the last census in 2015, when I was completing my MFA in Interaction Design at SVA. That was my first real exposure to open data, and I used some of the street tree dataset to build a wearable wristband that buzzed gently any time its wearer was approaching a ginkgo tree. (At the time, I lived in an apartment overlooking a sizable ginkgo tree that erupted in beautiful yellow leaves and rained foul-smelling fruit each fall. I miss it.) So participating in this season’s census was a no-brainer.
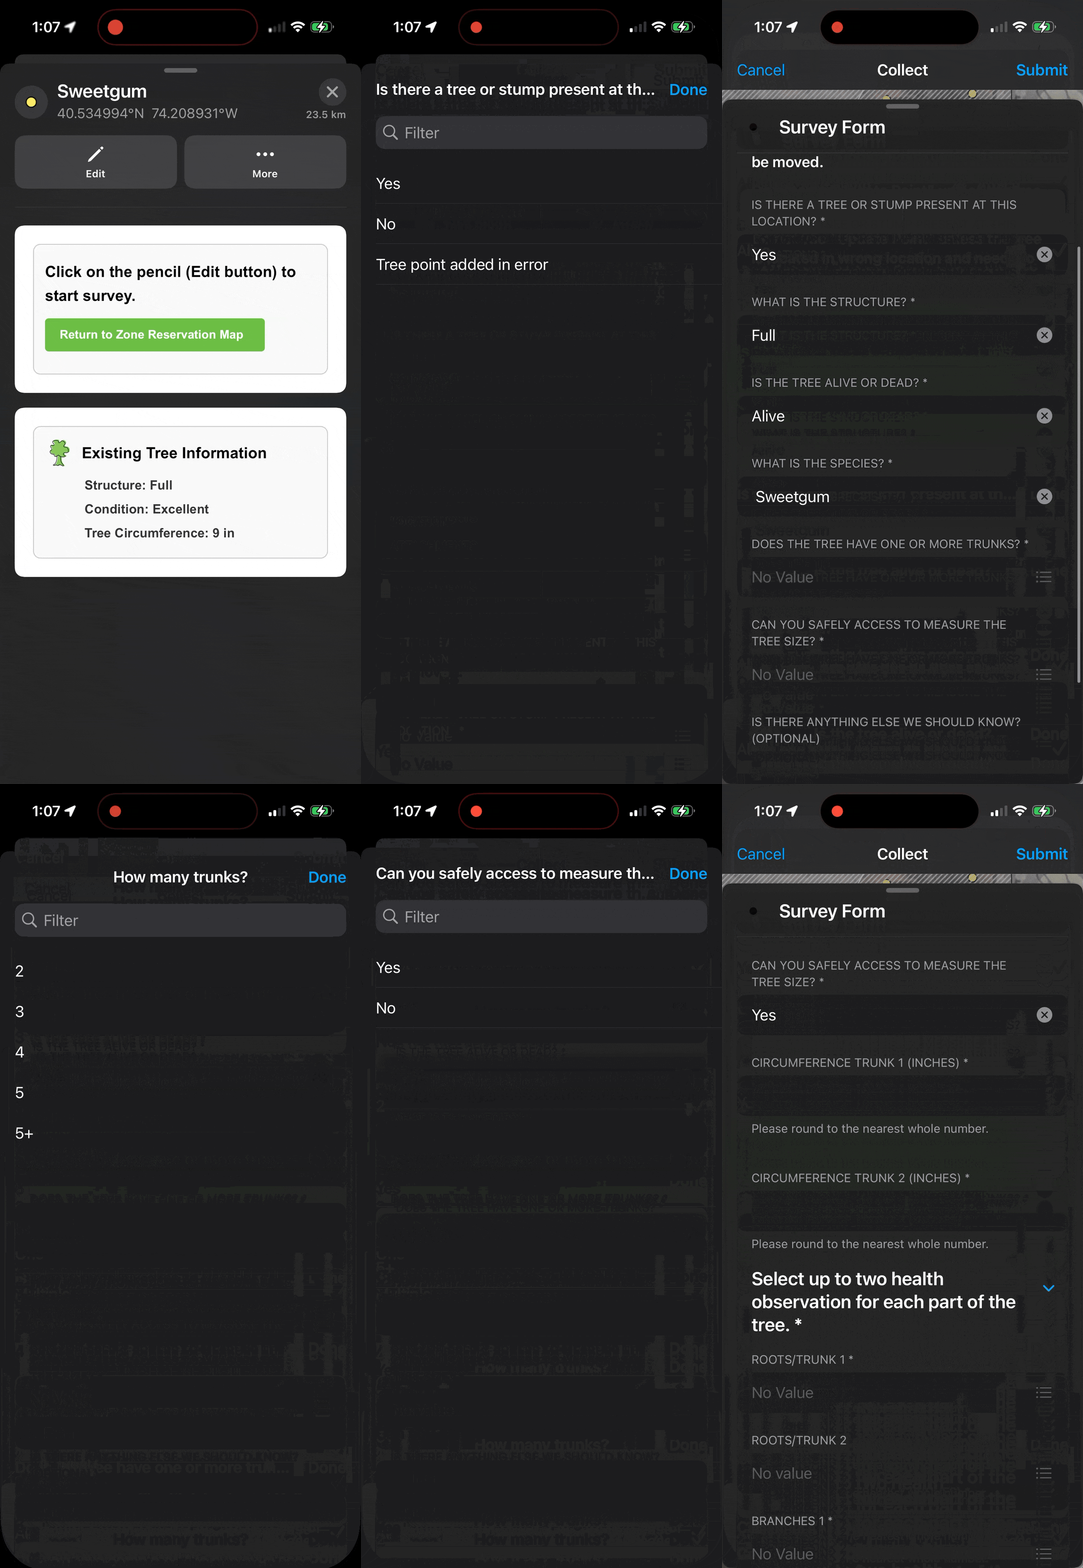
It would be hard to find a more motivated or underemployed volunteer than me, but I didn’t make a ton of progress on the census throughout the shoulder seasons (even after attending a super informative winter tree training designed to help volunteers tell the difference between all the suddenly-denuded trees out there!). This is primarily because I found the data-entry process in the Field Maps app to be so time-consuming! ArcGIS’s app just isn’t really optimized for the realities of field research, as far as I can tell. Field Maps is filled with lots of dropdowns that collect critical information, but also add a ton of friction to the process:
I should clarify that my UX nitpicks are all aimed at a third-party app that happens to be the only game in town for this type of geographic data collection — not at the truly wonderful folks running the census!
ArcGIS is, after all, software that’s designed to be good at one very specific, very complicated thing: the storage and retrieval of spatial data. It turns out that form design for data collection is a completely different type of problem, and the app isn’t quite as optimized as it could be for solving that problem. (Anyone who’s ever designed and then field-tested a survey can attest to how challenging and humbling it is!)
The issue is that the app’s form designer offers a super constrained set of options: you basically get drop-downs, checkboxes and radio buttons. And none of these are mobile-optimized in any meaningful way! The tap targets are super small, there are no ways to set meaningful defaults (e.g. it’s fairly rare to come across dead trees, yet that choice must be selected anew every single time), and no attention is given to where a user’s thumb is in space (the drop-down opens a full-screen view with options that are anchored to the very top of my iPhone’s screen).
This would’ve been enough to deter me, but I also found myself spending a lot of time juggling a variety of different apps on my phone: if I got confused about a tree’s species, I’d usually snap a photo with an ML classifier app like PictureThis, which is decently accurate but does a whole lot of annoying subscription upselling. And if it wasn’t feasible to wrap my tape measure around a given tree — like it was behind a fence or covered in poison ivy — I might open the iPhone’s built-in Measure app to measure the tree’s diameter, and then pop open the Calculator app to multiply that by π in order to get its circumference so I could input that into the Field Maps form. I also had to juggle a folded paper field guide and a fabric tape measure — and for trees too large for me to hug, I’d have to haphazardly throw the tape measure halfway around and try to grab it from the other side.
Woof. That’s a lot of work for just one single tree. (And there are ~178,000 surveyable trees in the app, of which just over 100k have been surveyed as of this writing.)
So just as I’d kind of reached the ceiling of my patience, I happened across a blog post reviewing an app for managing one’s wristwatch collection. Near the end, the post called out the developer’s use of an agentic devtools app called Bitrig that basically abstracts away a lot of the nastiness of working directly within Xcode and makes it super easy to develop and refine surprisingly sophisticated iOS apps.
Fast forward to today, and all of a sudden I’ve managed to survey 12,641 trees, putting me at the top of the leaderboard for Trees Count census volunteers as of this writing. That puts me just above the indefatigable Caleb Roenigk, who currently sits at 10,356 trees counted. (Caleb’s adventures as the then-most-prolific censustaker were recently highlighted in Hell Gate. I have a feeling that he’ll be back at the top of the leaderboard pretty soon, with or without my app, though I certainly hope he gives it a test drive!)
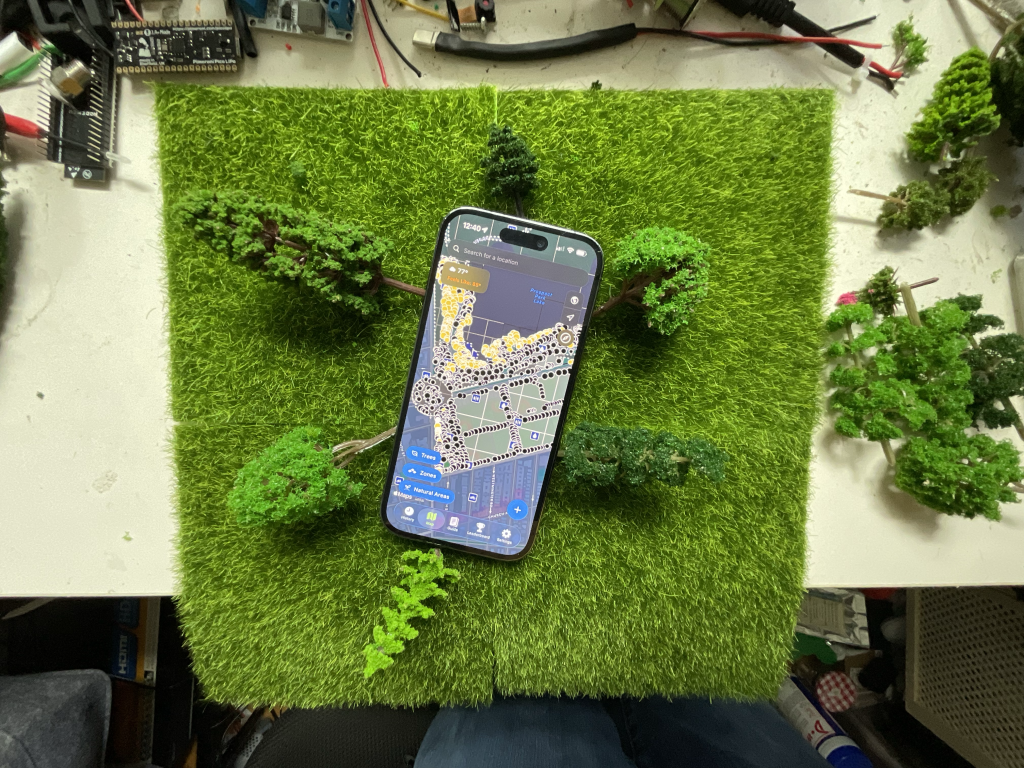
I do a lot of prototyping and hacking, but it’s been a minute since I tried my hand at making an iOS app. But after a month or so of developing and counting trees and field-testing and iterating, I’m excited to share my bespoke and completely unofficial tree census app: I’m calling it Rootstock.
The app
OK, let’s take a tour of Rootstock, including all its bells and whistles.
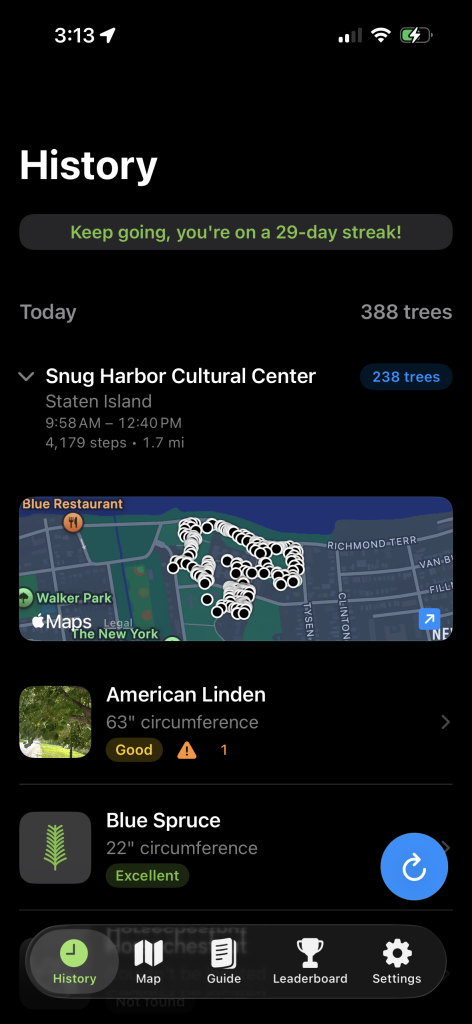
The app opens with a feed outlining all of the trees I’ve surveyed, grouped by date and park. I’ve linked it to Apple’s HealthKit, which means it has access to my step counter and can tell me exactly how many steps / miles I’ve walked for each given park! I recently added a cute little banner encouraging the user to keep a streak going. (It’s very funny to add gamification features to an app I’ve designed just for me. As though I’m a rat placing cheese at the end of my own maze, but maybe that’s just what life kinda actually is all about?) Yesterday I celebrated 35 consecutive days of tree-hugging by driving to Floral Park, Queens, about as far east as you can go in NYC before you hit Nassau County. I hit up a few pedestrian triangles carved up by the Long Island Expressway, a handful of playgrounds, and then counted a small grove of apple trees at the Queens County Farm Museum before heading back to Brooklyn.
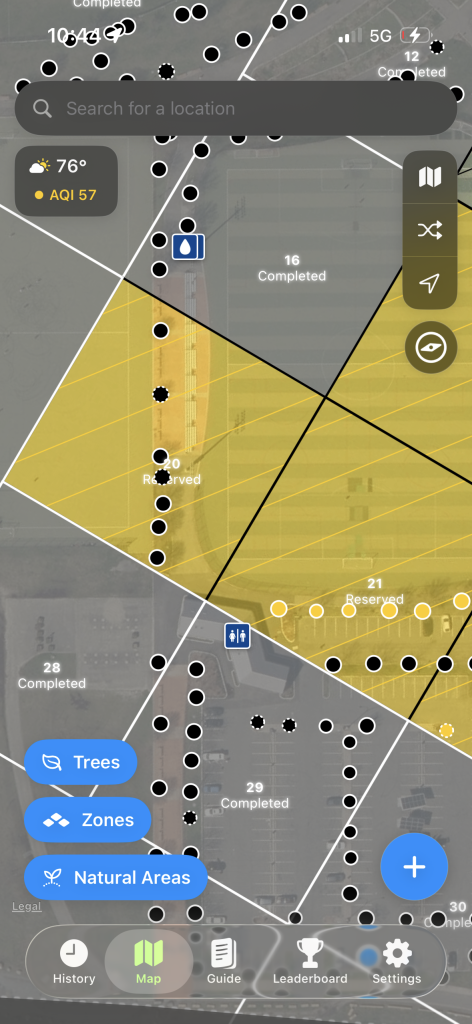
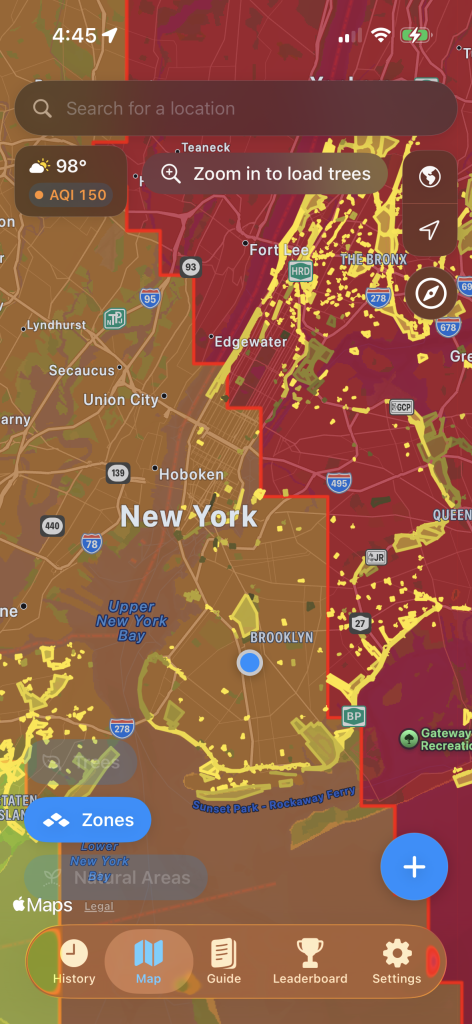
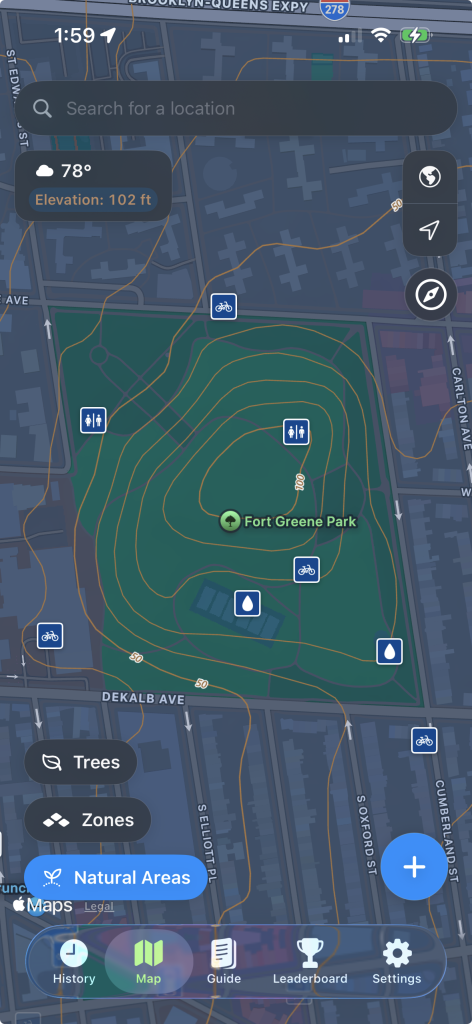
Now, the Map tab. This is really where users (again, this refers solely to me) spend most of their (my) time. Like Field Maps, Rootstock’s map displays zones, natural ares and tree pins, which the user can tap on to census a given tree (or they can drop a new pin to log a tree that the app doesn’t know about). But dig deeper and there are a lot of bonus niceties, each one based on a specific challenge I’ve faced in the field. First off, I’ve combined several separate data layers into one map, making it easier to manage both zone-reservation (the system the census uses to allow surveyors to mark specific parks as reserved, in-progress or complete) and to actually census individual trees. In Field Maps, these are two separate maps, forcing the user to swap between them frequently. So much friction! Among the bonus data here:
- Quick access to weather, AQI and pollen, along with heat maps (this was super helpful the other week when we were grappling with smoke from the Canadian wildfires)
- Useful amenities such as cooling centers, restrooms, drinking fountains and sprinklers
- A way to toggle between MapKit’s lush, green orthographic tiles and the slightly older, lower-resolution but taken-in-the-winter orthographic tiles provided by NYC! I often toggle between both because I benefit from seeing up-to-date aerial imagery of parks and playgrounds, but tree canopies can make it super challenging to properly place individual tree pins
- Integration with the Parks Department’s “Great Trees” program. This is a completely different dataset I’ve incorporated, featuring dozens of spectacular trees that the city has deemed culturally, historically or aesthetically significant. It’s cool to learn the backstory of a Great Tree when you stumble upon one in a park!
- An integrated search bar that not only makes it easy to search for specific parks and playgrounds, but also shows users (me) which nearby facilities have not yet been fully surveyed
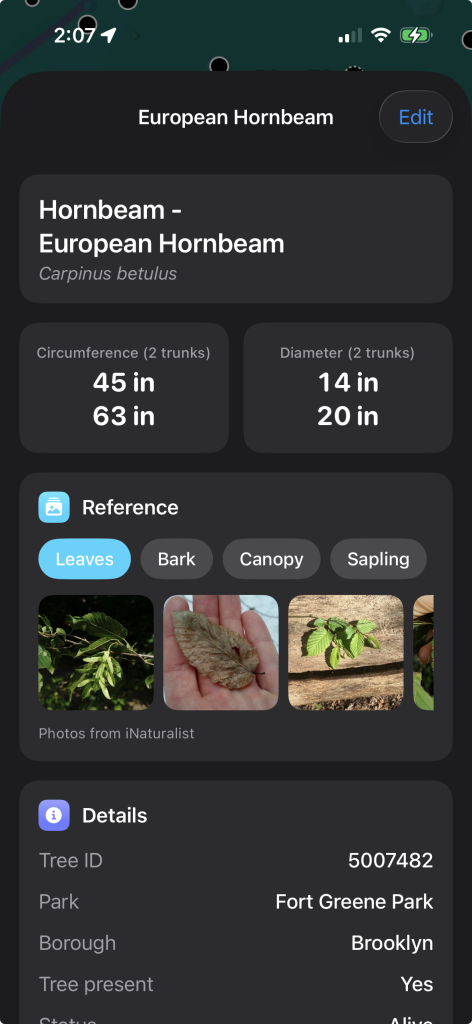
Tapping on a tree from either the History or Map tab brings users to a tree detail view for that specific tree, which they can edit in order to survey that tree. This is where the magic happens! Some fun integrations here:
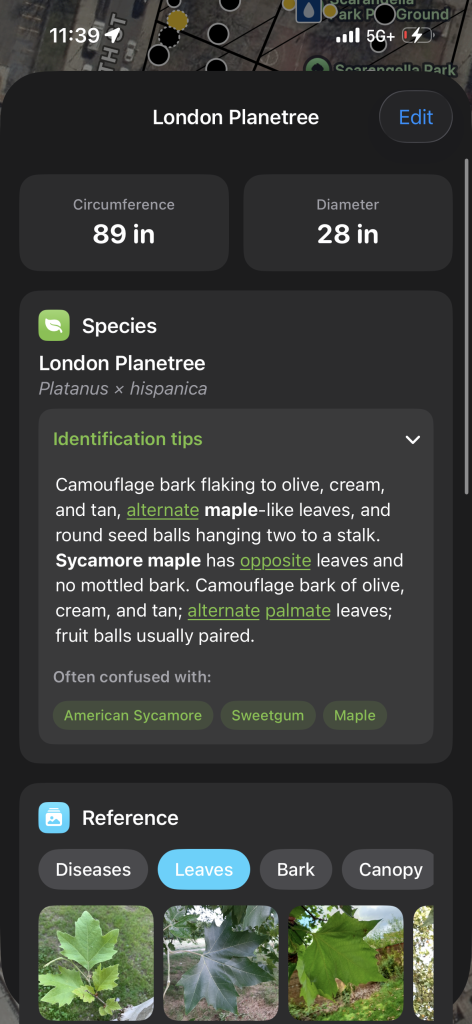
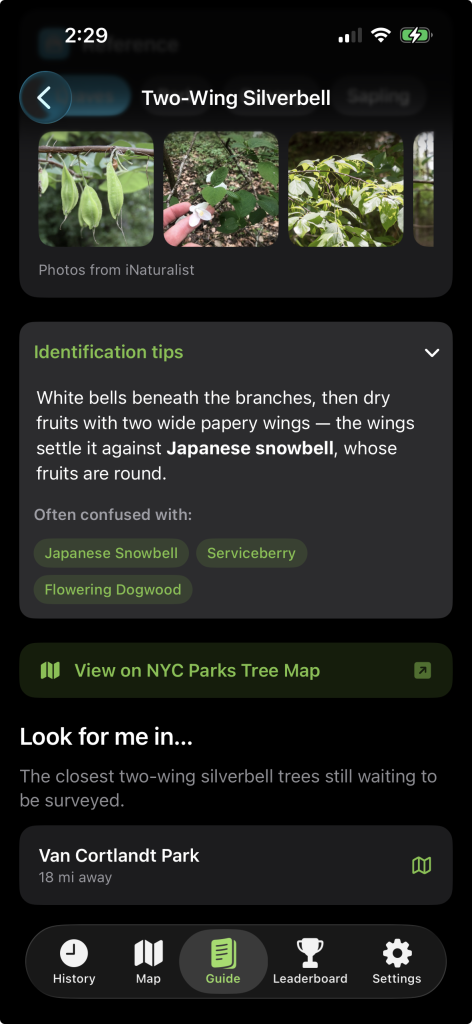
- Each tree loads reference photos from iNaturalist, as well as custom species-specific data (refined with Claude’s help) to help users distinguish lookalike trees.
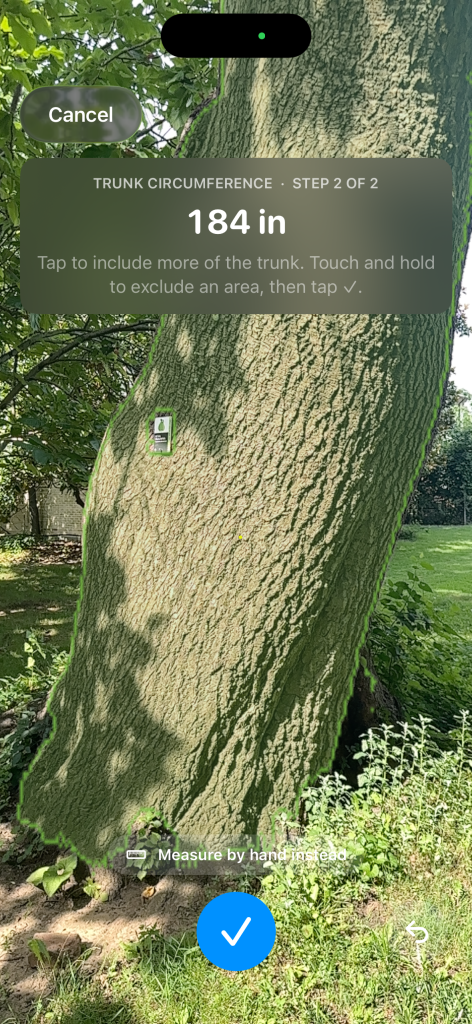
- There’s a ruler measuring tool that uses a SAM2 segmentation mask + LiDAR circle-fitting algo (based on this prior art) to make it super easy to take trunk measurements without having to always rely on fabric measuring tape or a separate measuring app. It’s quite accurate, generally +/- ~2″ or so. And of course it lets me measure trees that I couldn’t physically access otherwise.
- I’ve also incorporated an ML classifier model to assist with species identification. (This was a huge side quest! I thought this would be a super-easy solved problem, but it turns out it’s pretty hard to get decent accuracy with tree classification. For one thing, plenty of species look very similar to each other, unless you’re looking very closely at leaf arrangement or counting pine needles or other specific details. I tested several models, and for a long time I was using on-device ML with BioCLIP 2.5-Huge. Eventually I transitioned to the Pl@ntNet API, which does somewhat fancier preprocessing of images and was slightly more accurate with some of my field photos.)
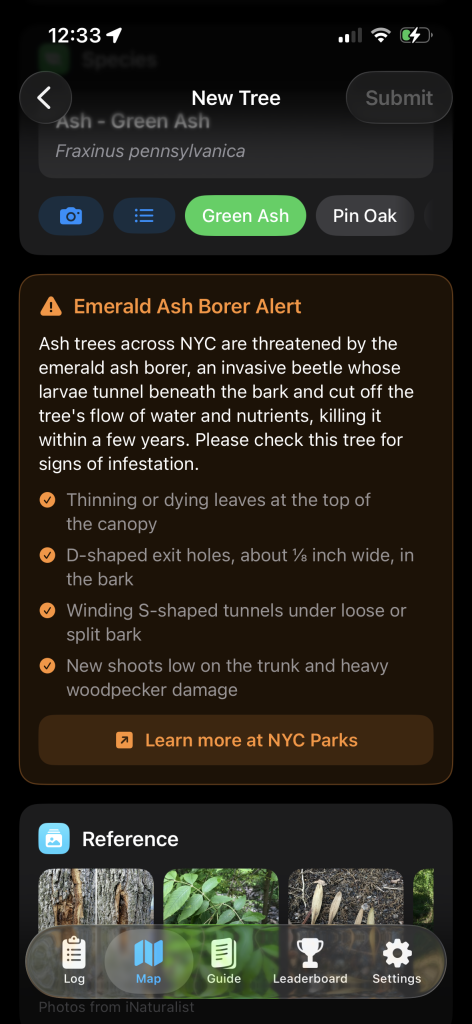
- When the ML classifier detects a species associated with a known invasive species, like the green ash tree with its emerald ash borer, it loads an alert. It also does this if it detects a toxic plant like poison ivy, oak or sumac in one of the uploaded photos.
- Trees can be nominated as Great Trees or forestry service can be requested, opening up the attendant Parks Department forms through webviews that pre-fill relevant data about the tree’s species and location!
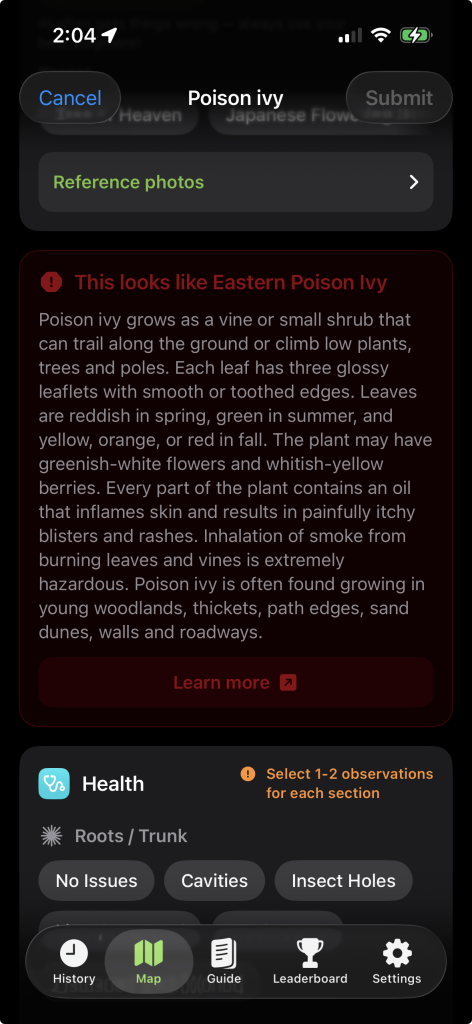
Perhaps most importantly, though, is that I’ve thoroughly reworked the form fields and optimized them for fast data entry. Gone are all the dropdowns from the Field Maps app. In their place, I’ve got smart defaults, lots of suggestions, plenty of easily tappable pills and auto-scrolling behavior so users (again, that’s me) can get data into the form as quickly (and accurately) as possible. My species search bar also includes common and Latin synonyms, and can handle minor typos. Did you know that a Linden tree is sometimes called a lime tree? Or a basswood? Did you know that a Callery pear and a Bradford pear are the same pear? Did you know that a London Plane can be either Platanus x hispanica or Platanus x acerifolia? Now you do (but with Rootstock, you don’t have to!).
We saw part of the Field Maps data-collection flow before, but here’s how it looks in Rootstock.
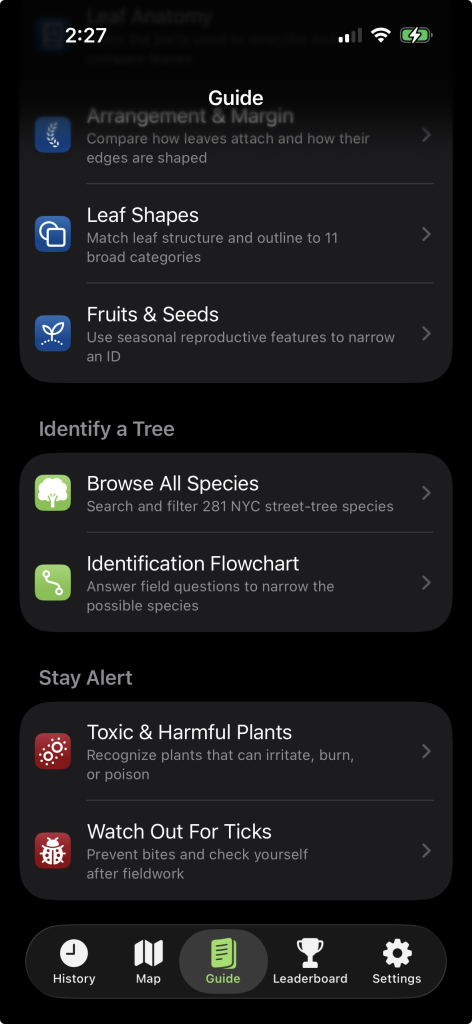
Next up, the Guide tab. Though I’m using ML to help with things like species identification, AI obviously gets things wrong all the time. I decided to incorporate a lot of the data from the Parks Department’s field guide handout into a native format, and backfill it with some additional context and imagery. Some of this is presented inline in the add-a-tree / edit-tree forms we just saw:
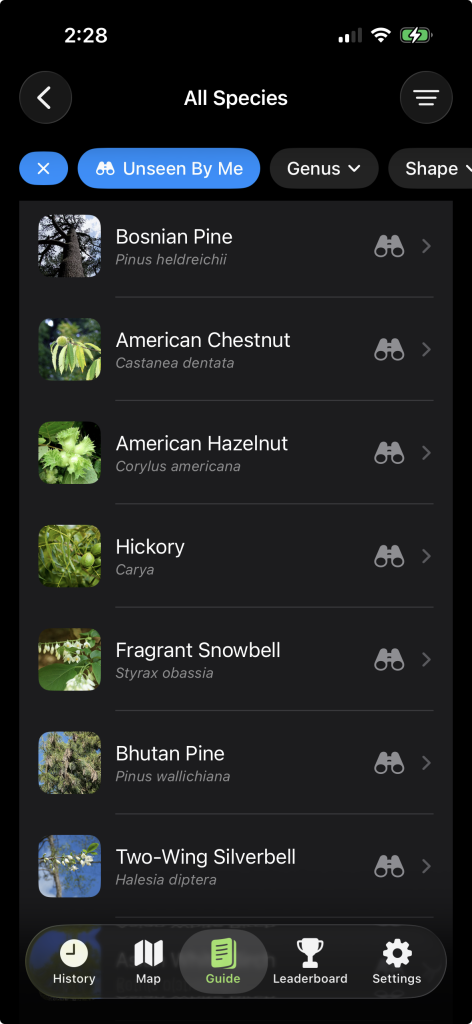
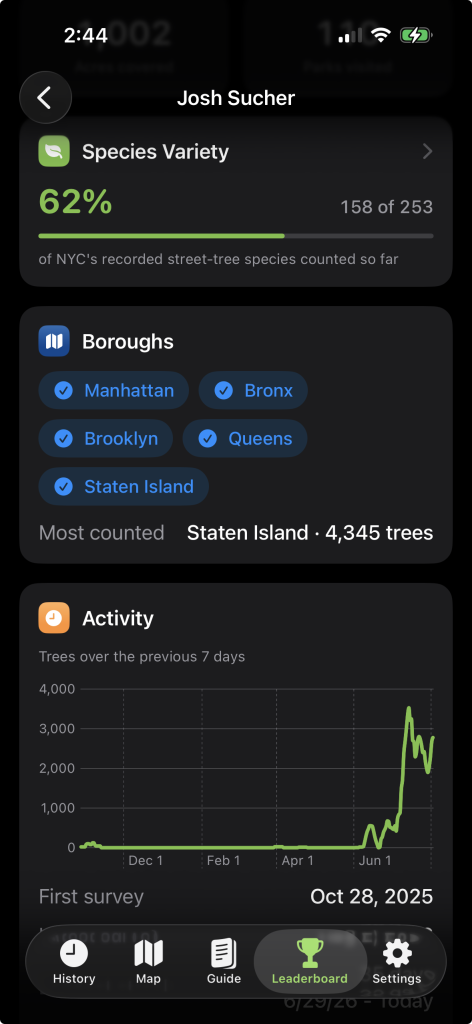
But the Guide tab takes things further. Here, I’ve included cautionary info about ticks and toxic/invasive plant species from the NYS DEC, as well as a robust – and filterable! – species browser. It loads reference photos from iNaturalist, and lets the user filter by genus, leaf/needle shape, reproductive mechanism (e.g. acorns, nuts, seedpods, catkins, etc) and – of course – by species the user (me) has not yet surveyed. (We’ll talk about the leaderboard in a moment, but as of today I’ve surveyed ~62% of the tree species itemized by the Parks Department in ArcGIS. I just found my first sassafras tree yesterday!) The list can be sorted alphabetically, but is by default sorted by frequency within the Trees Count dataset.
OK, the Leaderboard. I’ve had so much fun with this. I’ve thrown in just about everything I’ve wanted to know about my own surveying history here. That includes some basic metrics about how many trees I’ve counted, how many zones I’ve completed, how many parks I’ve visited, how many distinct species I’ve logged, and how many acres I’ve covered. It includes which of the 5 boroughs I’ve hit (all five, of course), and which one I’ve spent the most time surveying in (Staten Island – 4,345 trees). I’ve got a chart showing week-over-week progress, dates of my first and latest survey as well as longest streak and the dates I hit the most trees and the most zones. (Both were July 10th, one of the days I was wandering down the linear park behind the boardwalk on Staten Island’s South Beach.) I’ve got callouts for the most recent tree I counted (a black walnut), the rarest tree I’ve counted (a specific cultivar of red maple), and the largest tree (a 230″ American Sycamore in Alice Austen Park that is, yes, a Great Tree.) So much data.
Finally, a Settings tab. This is where users (me) can enter their ArcGIS credentials to log in and optionally link Apple Health for the step counter. I’ve got webviews for joining upcoming Trees Count events, and a robust credits page featuring all the resources I’ve used for tree photography, orthographic imagery, weather data, vector icons and more.
So that’s Rootstock!
Working with Bitrig
The last time I built an iOS app, it was for my interaction design thesis project almost exactly ten years ago. I was proud to spend several months polishing a functional prototype of a location-based e-commerce app for mom-and-pop shops built in Swift.
Times have changed.
Creating a highly sophisticated app over a 6-week period with a conversational language model has been nothing short of surreal.
Don’t get me wrong, I’ve used genAI for plenty of coding projects over the past few years. But Bitrig is… different. It completely abstracts away the complexities of coding with SwiftUI in an Xcode context — to the extent that I’m not entirely sure how to best describe my role. Am I a software engineer? No, not really. Am I a PM? Kinda. A designer? That isn’t really right either. A UX strategist? In some ways this is surprisingly close. But of course it doesn’t accurately portray a role that has never quite existed before.
Scope creep is near impossible to avoid. I have a fun thought and the cost of implementing it is comically low. I find an appropriate API endpoint, decide on some implementation logic, and set Bitrig off to make it happen. Don’t get me wrong — that’s still a lot of work. And as usual, the last mile is always where things break down. Claude, as usual, is very happy to do anything I ask it to do, whether or not the UX is actually sound. I have to push and probe harder: how many times are we making this API call as the user pans across the map? Can we find any clever ways to cache this content? Should we be using Map, or should we be using MKMapView()? Can we tighten up the visual hierarchy here? There?
Also, with Bitrig Remote, I’m able to make live changes and deploy them while I’m in the field. It’s been crazy useful when I’m standing in a park surveying trees! Just to say “dear Bitrig, let’s add an auto-scroll to the health metrics on the add-a-tree form, so that the form moves to the next section once the user has tapped on 2+ health pills” and then field-test it live two minutes later. Truly wild. I have no idea what other use case exists for this tool. My only guess is that it was designed for single-minded Bay Area tech bros who like to vibecode while on first dates. But I’m not complaining!
Wonderful things I’ve discovered along the way
It’s hard to count 10,000+ trees and not have learned a thing or two.
Perhaps the most interesting thing I’ve learned — I’m really burying the lede here — is that trees aren’t real? I mean, of course they’re real, but there isn’t a single, like, Linnean taxonomic phylum or order for trees. We just call things “trees” once they develop hard trunks and grow really tall. Turns out many species of plants have independently figured out the value of this over the past several millennia. (This is similar to how crabs have evolved independently several times.)
I learned that honeylocusts are badass. I mean, shrikes already knew this, but still.
I learned that poison sumac has an almost exact lookalike: winged sumac! The difference is amusingly subtle, given that winged sumac is not toxic. Also, did you know that poison sumac can be a shrub or a tree as tall as 20′?? And if you burn it then you just wind up with toxic rashy gas filling your lungs?
I discovered that the Eastern cottonwood makes the most iconic leaf-rustling sound in the wind. It’s joyous. Head over to Ferry Point in the Bronx or down to Calvert Vaux Park in Gravesend on a breezy day and hear for yourself.
I also discovered what is possibly the strangest park in the city and certainly one of the smallest, Calvary Monument. It’s a tiny public park nestled within a private cemetery, featuring historic Civil War busts. (There are no trees. I’ve checked!)
Also, we have so many amazing parks and playgrounds in this city. Many of my personal favorites are in Staten Island: Silver Lake Reservoir, the South Beach boardwalk, Snug Harbor. So verdant, so quiet, so beautiful.
But I spent some time in what might be my new favorite park this weekend, and it was the opposite of quiet. I was surveying early Saturday morning at Canarsie Park where I saw a park full of tents, balloons, coolers, picnic blankets, and so on. Areas were roped off. Not a single picnic table was free. I asked a woman what the event was, and she said “oh, it’s like this every single weekend. Some folks are here for family reunions, birthdays, graduations, church events…” I thought for sure that such a crowded, lively park must mean intentional, planned programming.
Nope. Just New Yorkers living their best lives. A beautiful thing.
Join me!
OK, did this inspire you at all? If so, take a training and start counting trees! Become a Rootstock beta tester! Hit me up and wander through parks with me trying to figure out the difference between a pin oak and a northern pin oak. There’s truly no better way to spend a summer in NYC.