
Counting Cars
I really, really like reporting potholes. It’s an odd pastime, sure, but it turns out it’s really empowering and satisfying to be able to make a difference in the cityscape. There are so many maddening problems that seem unsolvable in a city this big — but somehow, miraculously, potholes are low-hanging fruit. Once you complain, the city will repair them often within just a couple of days. (The NYC DOT is rightly proud of this — they even had a pothole tumblr touting their work for a few years!)
(Update, spring 2024: I gave a talk about this project for BetaNYC’s Open Data Week / School of Data 2024! You can view it here.)
Potholes are a quick dopamine hit, but every once in a while I need a bigger fix. Fortunately, there’s an opportunity on every corner!
Many years ago, I learned from a friend whose father worked at the DOT that anybody can write in and request that the city install a traffic control at an intersection. Doing this automatically triggers a surprisingly thorough traffic study! The city will send someone out and that person will count cars and pedestrians, measure speed, identify any noteworthy features of the intersection and use this data to grant or deny the request. I’ve done this a few times, with varying success. I still remember my first tango with this process: the city denied my request to install an all-way stop, but they did daylight the intersection as a result of my letter, removing some curbside parking spots at the corner and greatly enhancing visibility. It’s still satisfying to see each time I drive past my parents’ house — even though I suspect some of my car-owning neighbors aren’t quite so happy. (Did you know that daylighting every intersection is mandatory per state law, but that the NYC just… exempts itself? Incredible.)
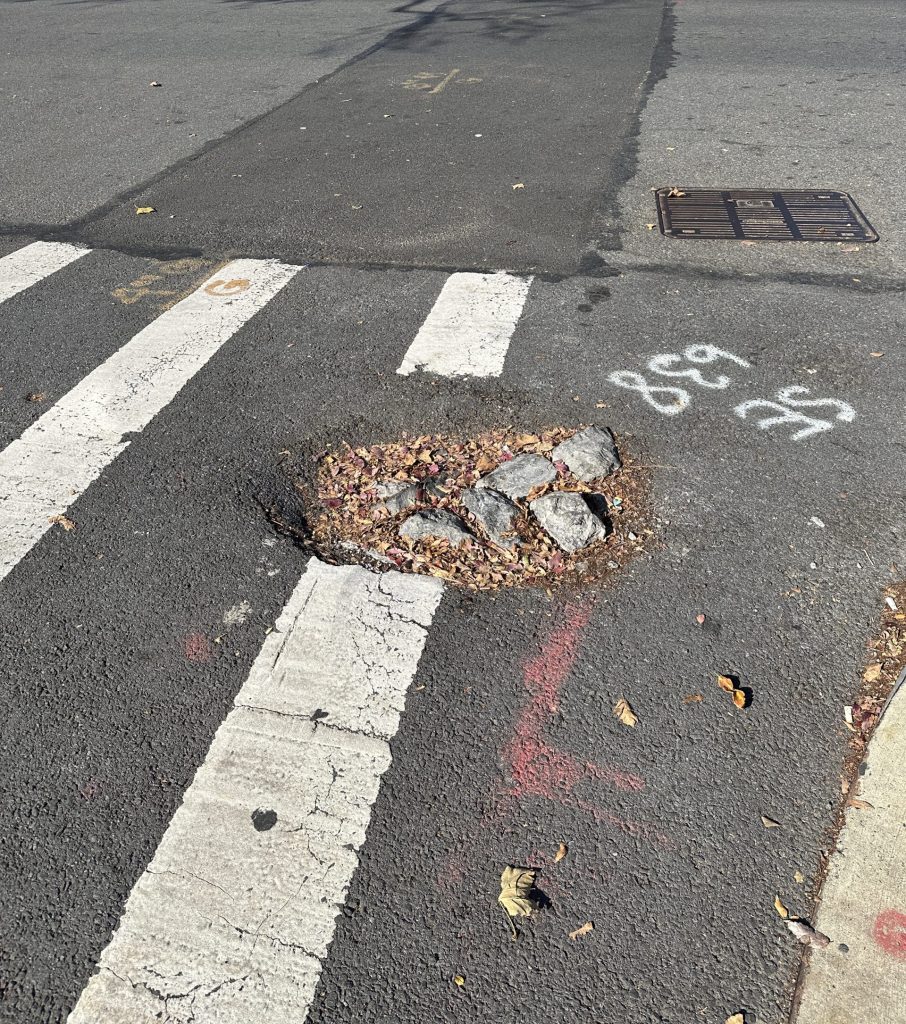
About two years ago, we moved into a new apartment in Brooklyn overlooking a particularly troublesome intersection — it’s a fairly major east-west route, a very wide one-lane road with very few traffic signals running across the length of it. So naturally drivers careen down it! I only had to cross the street once to realize I (or someone) would be mowed down here sooner or later.
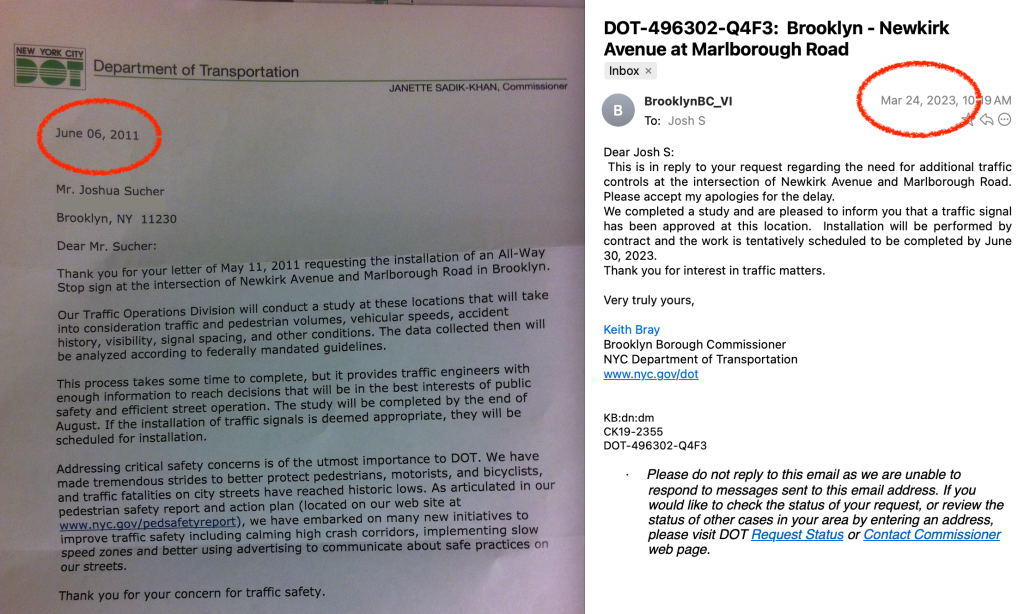
I wrote my usual letter to the DOT, and a few months later I was surprised to get this rejection:

Ridiculous. I sent a few follow-up requests, thinking maybe if I altered my ask someone would finally do something. I asked for a crosswalk without a traffic signal: nope. I asked for a neckdown (those sidewalk extensions you often see at crosswalks, designed to increase visibility and reduce the time it takes pedestrians to cross the street): no dice. I asked for a speed bump: nope, too close to a fire house. I asked for proxy solutions like a bike lane and lane-narrowing striping. Then I ran out of ideas.
Actually, I had one more trick up my sleeve. I decided to file my first-ever FOIL request to see the results of the traffic study I’d triggered two years ago. FOIL is the New York version of the Freedom of Information Act, allowing anyone to request any of a vast trove of records from any city or state government agency. A few months later, I had access to a 34-page PDF with all the juicy details of my study — including all the complicated criteria the city uses to determine whether a new traffic signal is justified!

Just a little bit of digging suggested the city’s study was full of issues: I was able to find far more than the one collision listed at my corner within just a few minutes of searching the OpenData portal. Plus, the study was conducted in July 2021. Traffic during the late summer months is always lighter, and a certain pandemic really messed up traffic patterns for a while.
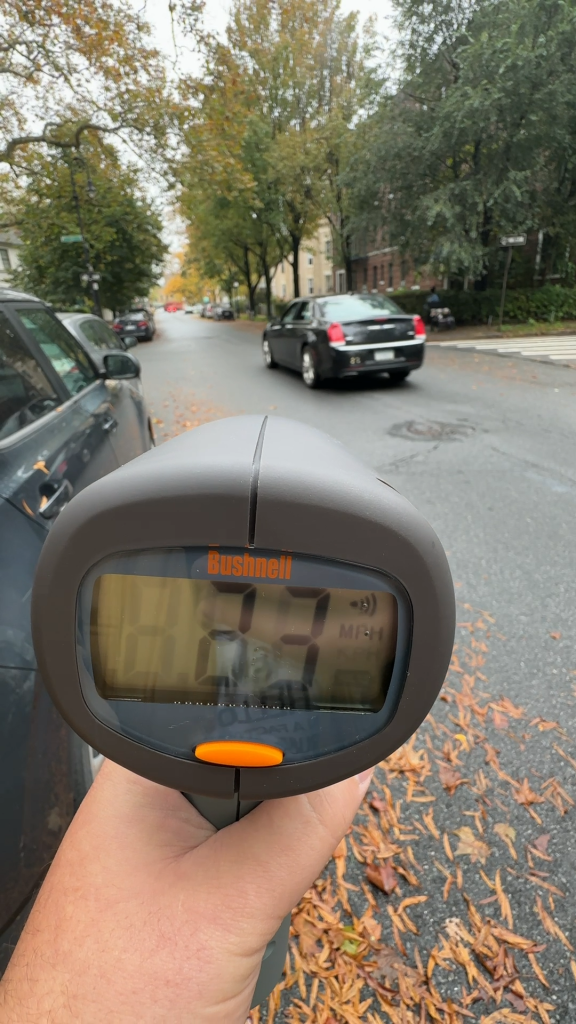
So since the city wasn’t budging, I decided to run my own traffic study. I tried to collect the same data as the original traffic engineer had, from the same times of day and days of the week. I went out and bought a radar gun! And I set up a camera in my windowsill to collect footage to analyze later.
Using true Engineer Brain logic, I spent about a week trying to perfect a script that would automate the process of counting cars, pedestrians and gaps in traffic for my study, rather than spend two hours manually analyzing the footage.
I used a combination of computer vision tools for object detection, tracking and annotation, a mix of YOLOv8, ByteTrack, and Supervision, and used ChatGPT to assist with the script. The object detection was pretty easy to implement (and yielded really impressive results), but the devil was in the details: getting the script to accurately track and count each individual car, including the gaps in between, for traffic heading in two directions, with many visual obstructions such as parked cars and trees.
Essentially the script works by defining a polygon zone for each intersection, using the polygon to mask the source image, then processing the video frame-by-frame to detect cars within that mask. Then it annotates the source image with the bounding box of the objects it detects, labels defining the object’s class and tracker ID, and each polygon zone. I have it add each tracker ID to an array, checking to make sure that the ID wasn’t accidentally triggered by filtering against the other polygon zones. It’s very much a work-in-progress, but free to check out the spaghetti code that produced this via this github gist.
# assign a polygon zone to each detection area

polygons = [
np.array([
[260, 684],[260, 456],[312, 516],[308, 604],[372, 624],[372, 676],[312, 684],[256, 684]
]),  #westbound
np.array([
[34, 889],[18, 613],[158, 713],[170, 881],[34, 885]
])  #southbound
]
# trigger the counter when a detected object matching a car, truck or bus enters the zone
zones[1].trigger(detections=detections[np.isin(detections.class_id, car_classes)])# add the car's unique tracker ID to an array, assuming it wasn't assigned in a previous frame or it didn't enter the zone after triggering one of the other zones
for class_id, tracker_id in zip(westbound_detections.class_id, westbound_detections.tracker_id):
if class_id in car_classes and tracker_id not in unique_tracker_ids_south: unique_tracker_ids_west.add(tracker_id)# set a timestamp each time a unique tracker enters the zone, for pedestrian gap analysis
if len(unique_tracker_ids_west) > previous_in_count_west:
print(f"Westbound car detected at frame {frame_num}")
timestamps_west.append(frame_num / 30) # assumes video running at 30fps
previous_in_count_west = len(unique_tracker_ids_west)After a few days of wrestling with it, this is about the best I could do (sped up 4x for dramatic effect):
In the end, I decided that the data I sent over to the DOT would be more credible if I could vouch for its accuracy, so I wound up running a manual count anyway. I sat at my computer watching my footage at 4x speed, furiously mashing the ‘split’ button on a stopwatch app each time a car passed, to map the pedestrian gaps. Then I did it all over again with a score-keeper app, to count individual cars going straight and turning. Then I did it a third time, to count pedestrians and distinguish adults from schoolchildren. All to populate a byzantine form filled with data visualizations like this:

And this time, I had ChatGPT help write my letter. I speak softly, but I can prompt an AI to carry a big stick.
Write a letter to NYC DOT Commissioner Ydanis Rodriguez vehemently insisting on the installation of an all-way stop (replacing the current one-way stop) at the intersection of Dorchester Rd and Westminster Rd, in Brooklyn. Note that the last traffic study, performed in July 2021, led to a denial of my last request, but that this study had many inaccuracies, and that I ran my own traffic study in October of 2023 and am including it with my request, along with the 2021 study for reference. Note that the maximum 60-minute vehicular volume I identified was 491 (vs 365 in the original study), the maximum count of schoolchildren was 37 (vs 8 in the original study), the number of accidents in a 36-month period at the intersection is at least 7 (vs 1 captured in the original study), and the number of pedestrian gaps at the intersection in a 60-minute period I identified was 55 during the morning rush hour, rather than 131. Calculate all the percentage differences. Explain that an all-way stop is necessary under MUTCD warrants 1A, 4, 5 and 7, per the intersection control data collection analysis factor sheet provided with the original study. Include the following links for source material: [links]What did I learn about my intersection?
- 7 crashes over a 36-month period, not 1
- 491 cars counted in a 60-minute period, not 365
- 37 schoolchildren crossing the unmarked intersection, not 8
- 55 adequate pedestrian gaps, not 131
I just mailed off my DIY traffic study to the DOT this afternoon. Hopefully this convinces them.
And hopefully it convinces you to complain (just stick to filing 311 complaints about streets, not your neighbors)!
Update (December 15, 2023): The DOT reached out and has informed me that they’re fast-tracking another study at this intersection! (It’s not a stop sign, but it’s a start.) Plus, I was invited to give a talk about this project at the NYU Center for Urban Science + Progress this week, as part of the Transit Techies series. Check it out here: